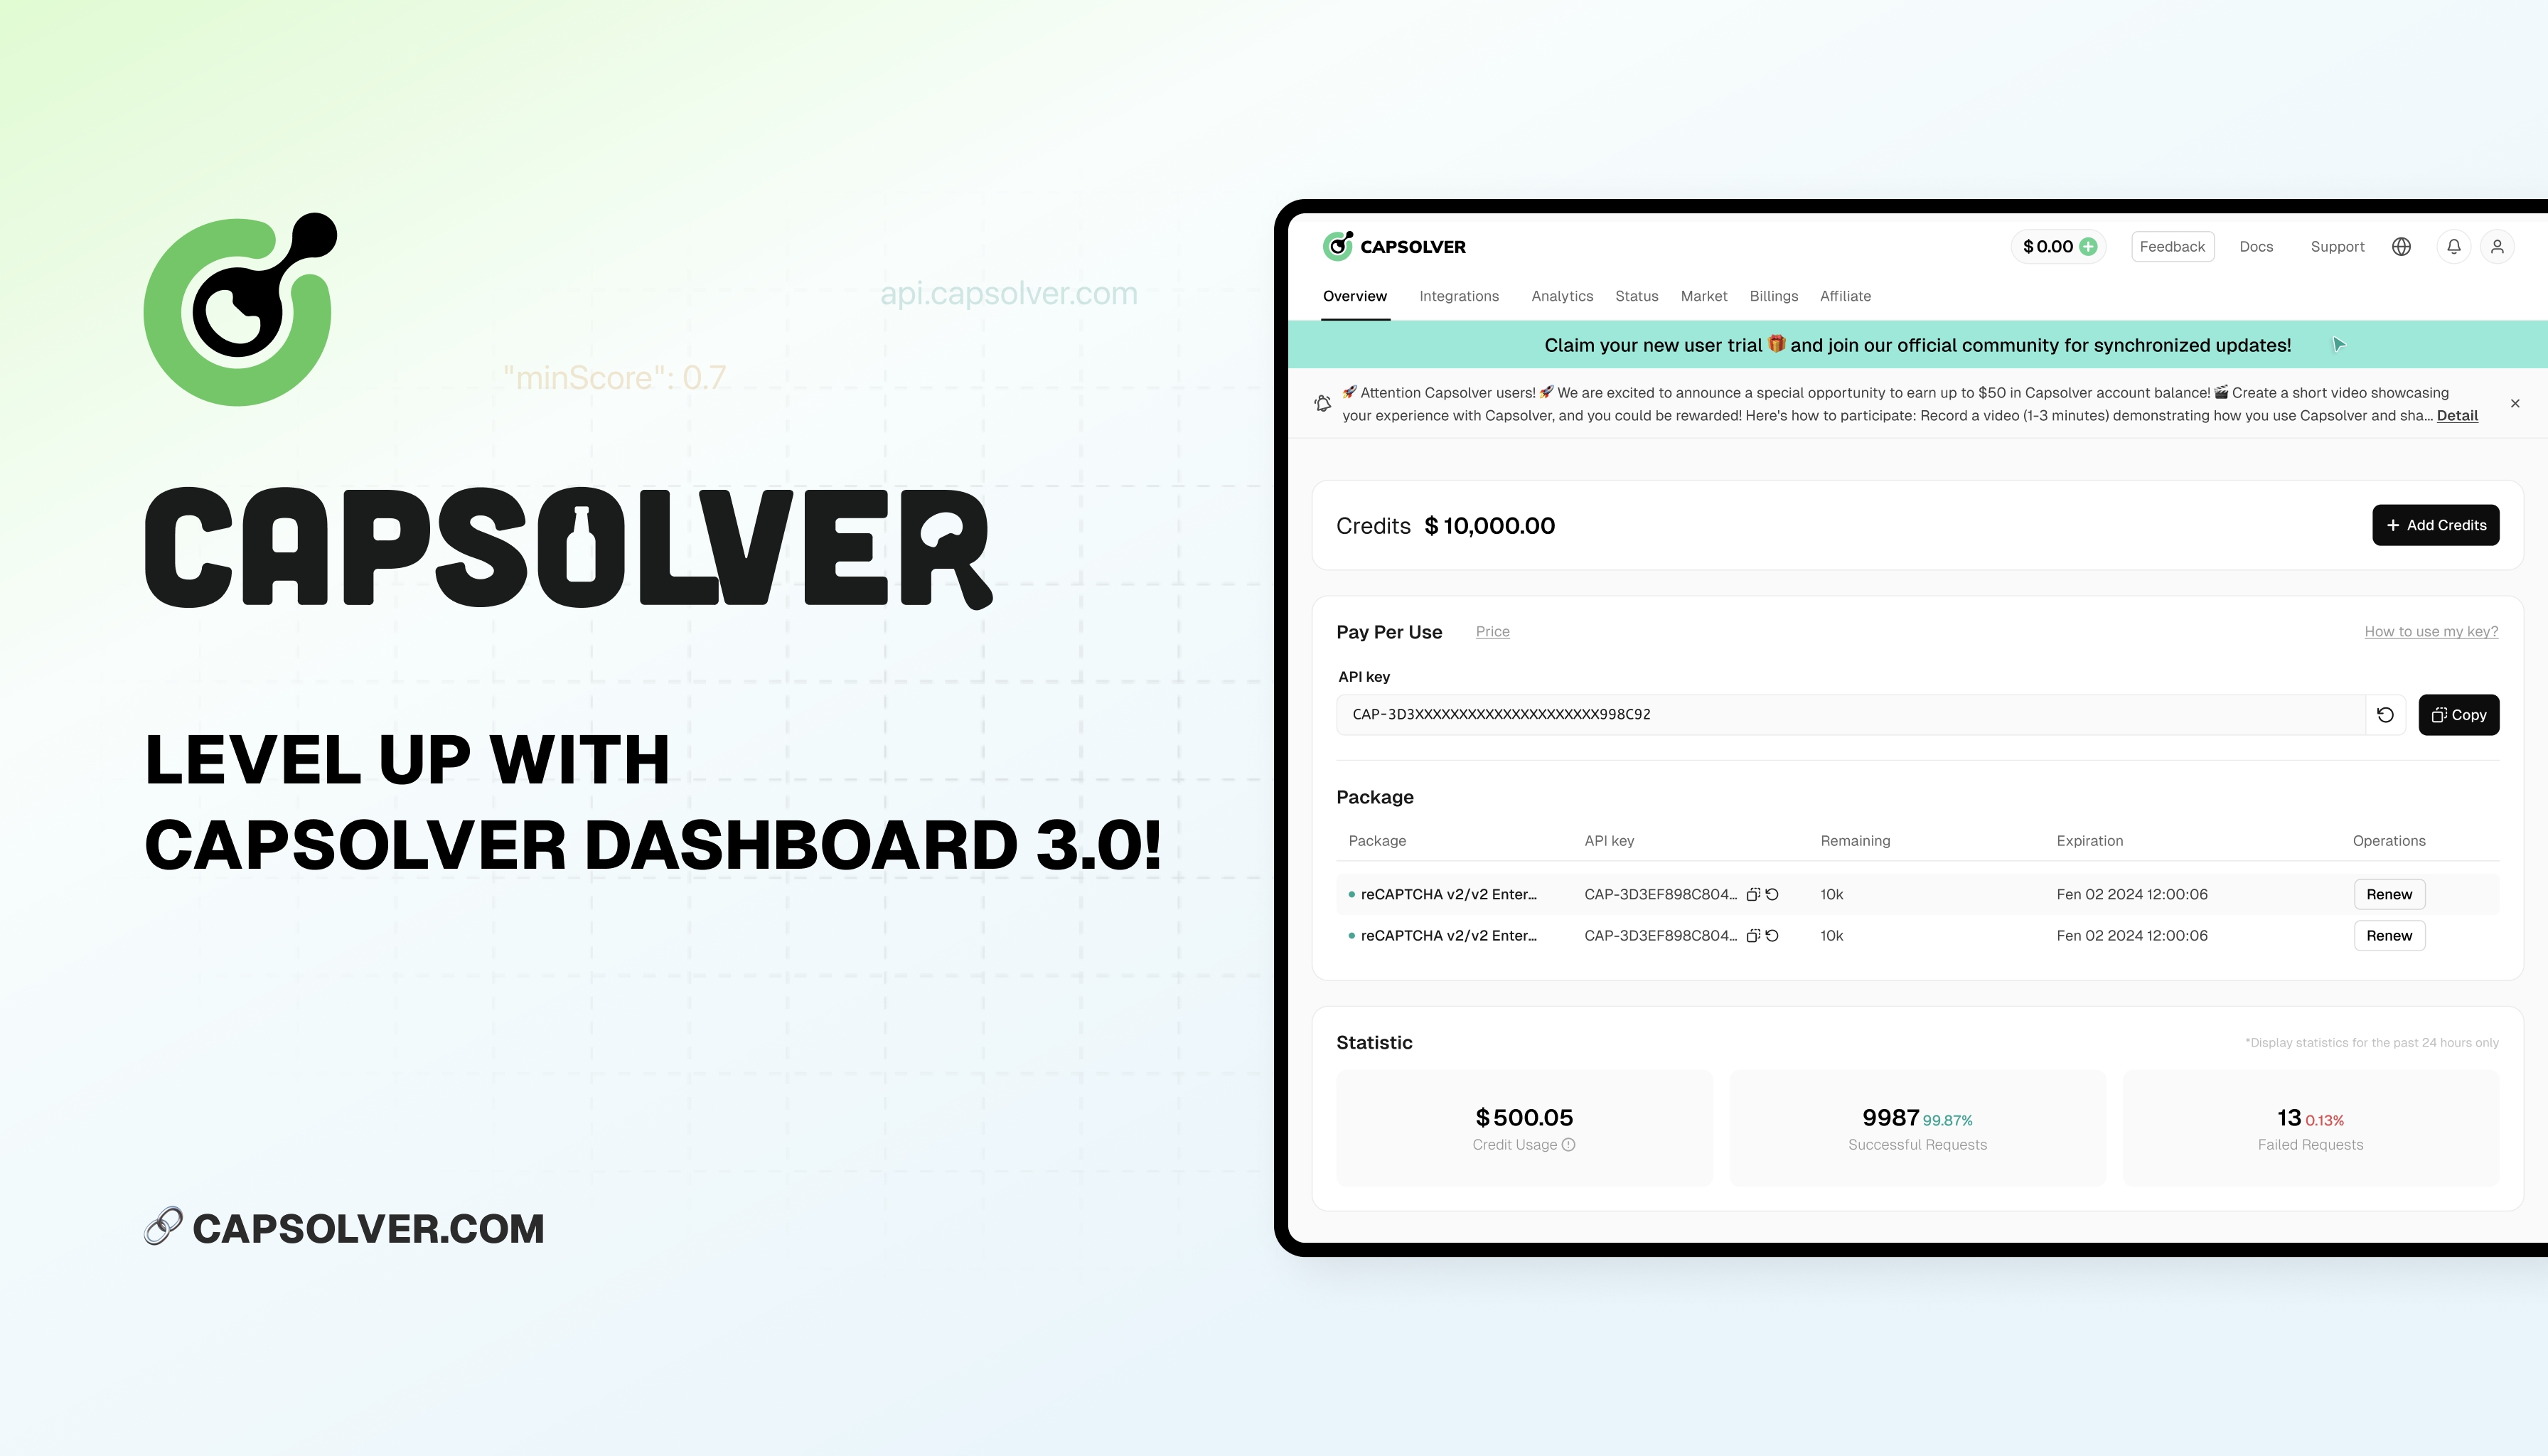
It is with great pleasure that we introduce the upgraded dashboard 3.0, designed to enhance the user experience and provide comprehensive data insights. Included in this major update is a completely revamped user interface, new functional modules and advanced data analytics capabilities. Below we can take a closer look at a few of the key highlights of the update:
1. User Experience Upgrade
For Dashboard 3.0, we have completely optimised the interface with a more modern and intuitive design. The new UI layout is not only cleaner and clearer, but also more aesthetically pleasing, making it quicker for users to find the features they need. Not just a visual upgrade, but a complete rethinking of how users interact with our platform. Overall we have restructured the "Overview" section and added new modules: "Integrations", "Usage" and "Status". The 'Billing' module has been enhanced to provide more detailed and accessible information. Also, the "Market" and "Affiliate" sections have been refreshed to ensure a seamless and intuitive user experience. We've also introduced a feedback feature that simplifies the way users can share their experiences and suggestions. There are more features we're going to dig into in detail next!
2. Comprehensive Data Analytics Panel
To help you better understand and manage your data, we've added a new Analytics panel to Dashboard 3.0. This panel provides a visual representation of your usage, including key indicators such as success rate, fail rate, number of requests, and more. With this data, you can get a comprehensive view of your usage, find room for optimisation and improve overall efficiency.
Time Dimension
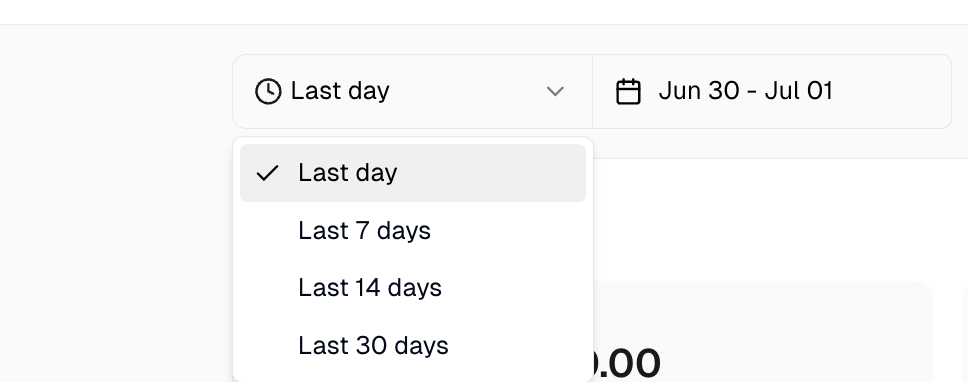
Understanding data trends over time is crucial. Our new data panel defaults to displaying the last 24 hours of data, with quick options for viewing the last 1, 7, 14, and 30 days. Users can also customize their date range within the last 30 days, providing flexibility in data analysis.

Overview - Data Dashboard
- Credit Usage: Displays total expenditure.
- Successful Requests: Shows the total number of successful requests and the success rate.
- Failed Requests: Indicates the total number of failed requests and the failure rate.

Recognition Stats
Our recognition statistics now support export to Excel, and the data range is the currently selected time range, and can be more convenient for users to analyze data.

Failed Rate
Similar to recognition stats, the failed rate is depicted in a line chart.

Spend Stats
This section displays the total expenditure for the selected time period, with a bar chart breaking down costs by type: "Pay per use" and "Package." Hovering over the chart provides detailed spending information

Last Hour History
For those needing granular data, the "Last Hour History" table lists detailed call records for the past hour, with filters for Captcha type and task status. This table supports pagination, displaying up to 5 records per page.

3. Real-Time Service Status
Keeping track of service status is critical for our users. The new "Status" module offers real-time updates:
- Service Status: Displays the current date and time, recent data (Success Rate, Avg. Solve Time) for the past hour of all supported Captcha.
- Updated Logs: Lists updates in reverse chronological order, providing a clear view of recent changes.
4. Account Management Page
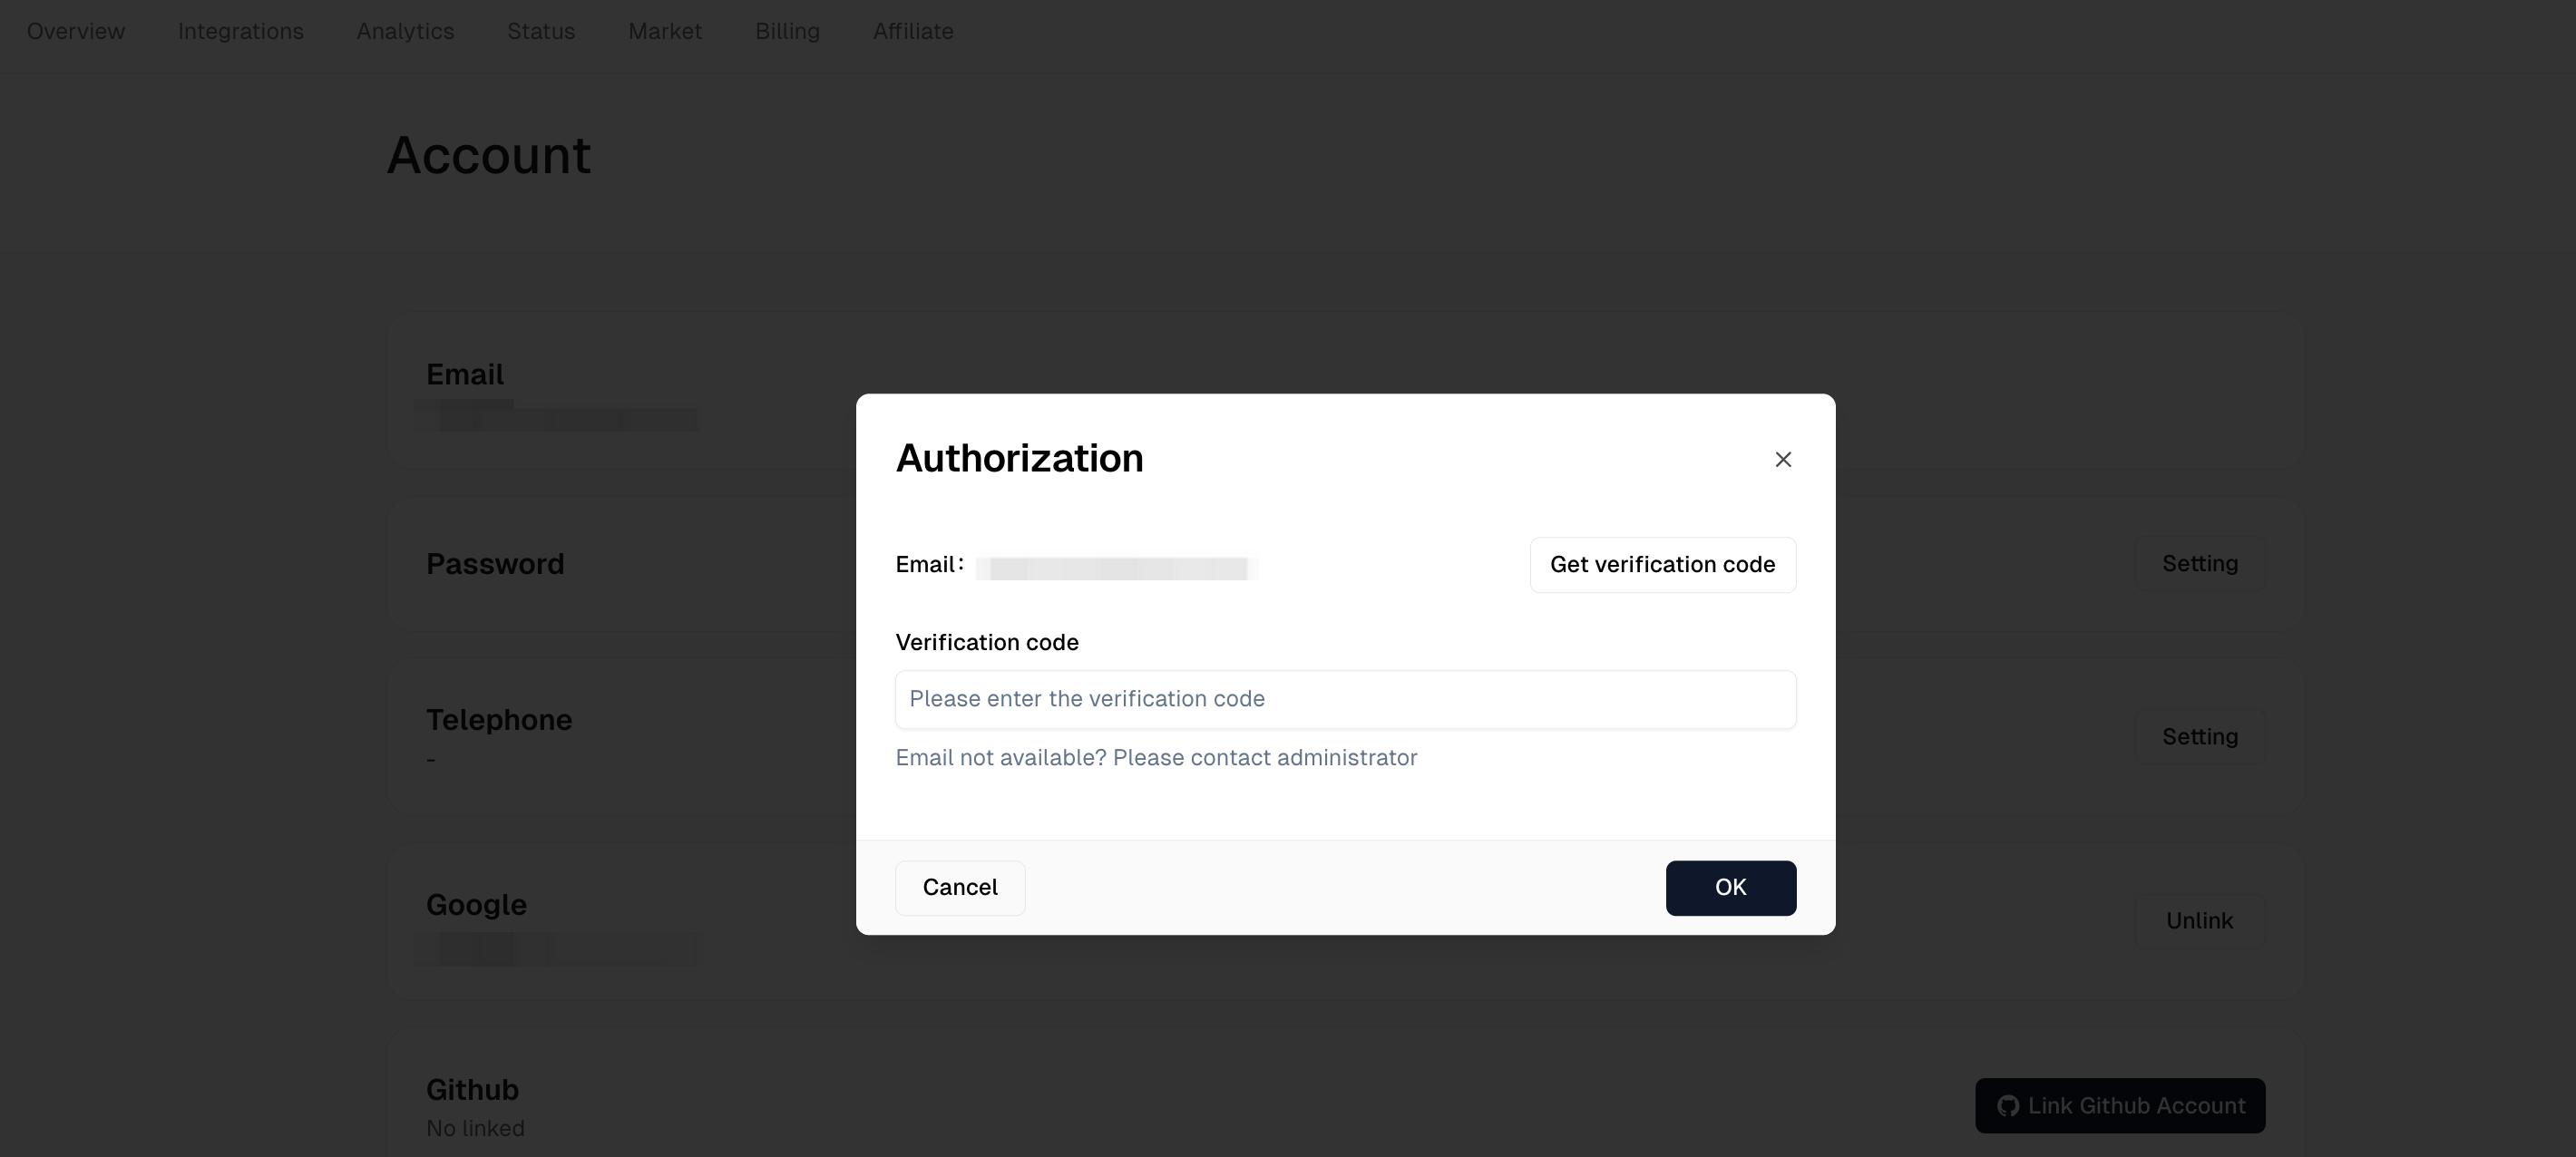
Manage accounts more securely with new features like password updates and 2FA (two-factor authentication) settings. You can also bind your github for easier login.

5. Additional Upgrades
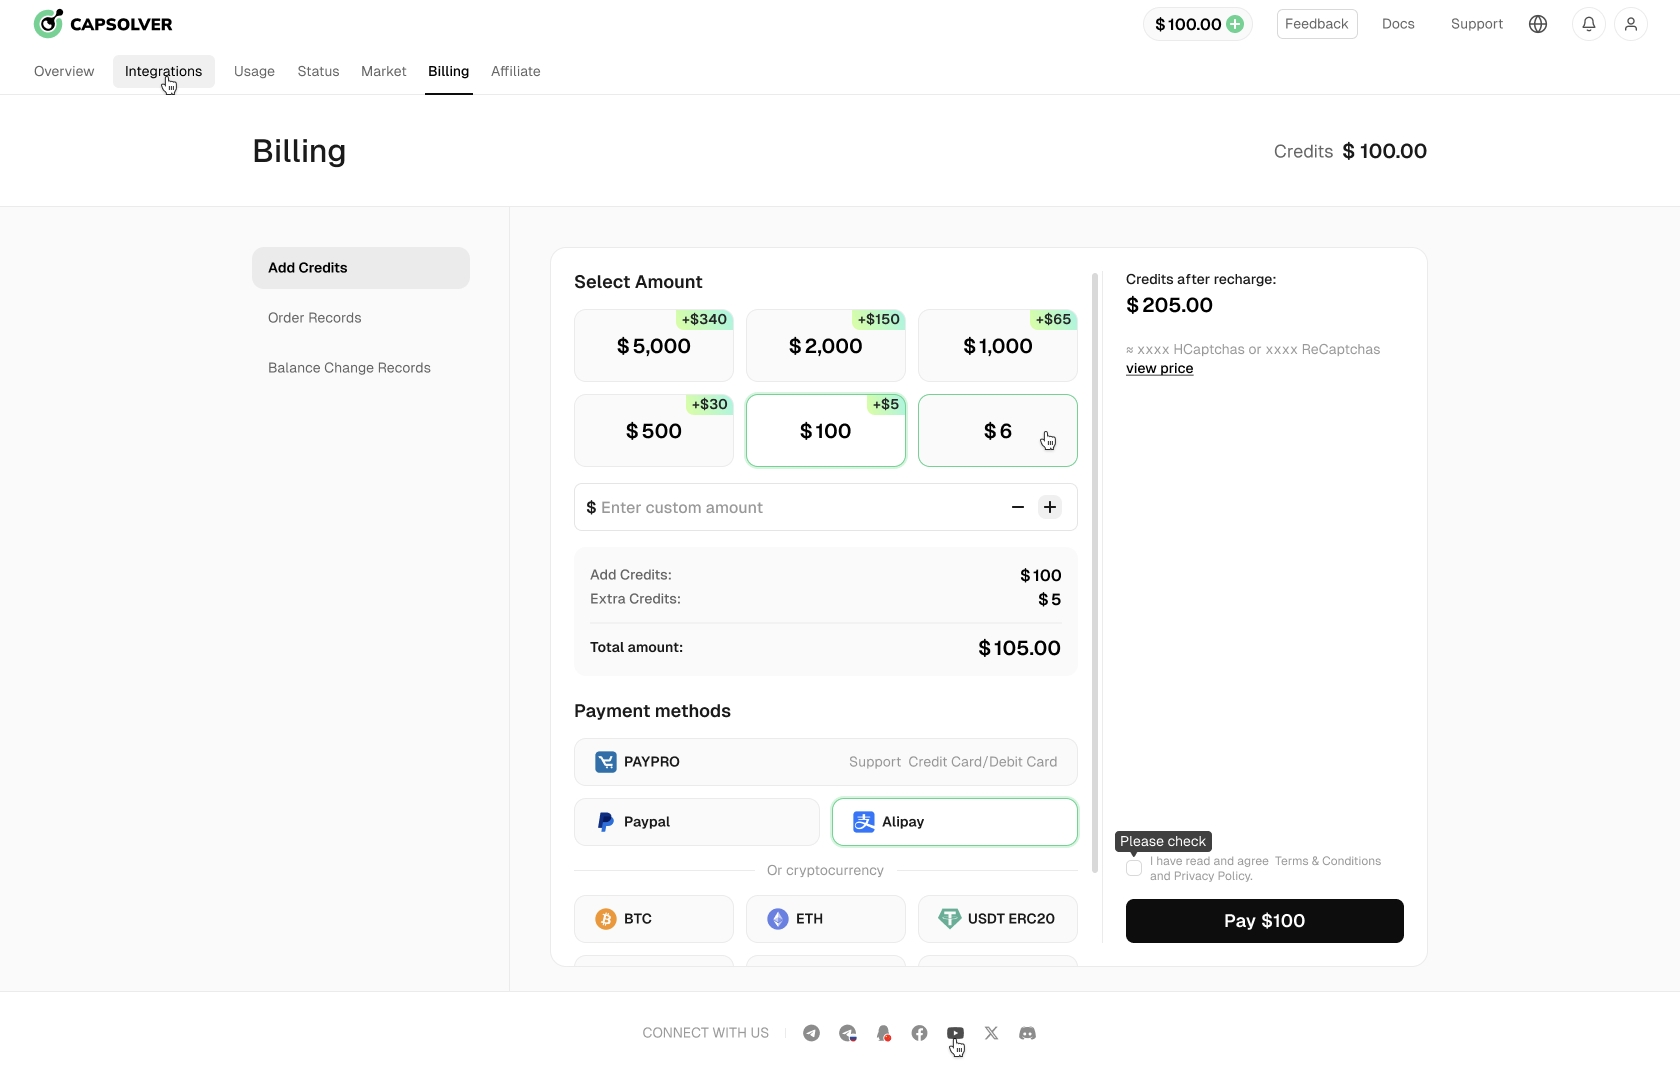
In addition to the above updates, we have also revamped the Billing and Affiliate programs. Not only have we redesigned the entire page layout, but we have also added some new details. For instance, we have enriched the data in billing order records, allowing users to convert them into Excel format for better financial visibility.

Furthermore, to ensure uninterrupted service and facilitate package management for users, we have introduced two new auto-renewal features (Coming Soon).
- Auto-Renewal for Packages: Users can set a threshold for package usage, and when usage reaches or falls below this threshold, the package will automatically renew, deducting the fees from the balance.
- Automatic Payment: To activate this feature, users need to contact customer service for corporate KYC verification and provide the threshold amount and auto-recharge amount. Once authorized, users can link their credit card to their account. When the balance falls below the threshold, the account will automatically recharge, ensuring users always have sufficient balance to maintain their service. This feature can also be disabled in the dashboard.
Conclusion
At CapSolver, we are committed to providing the best possible experience for our users. Our new dashboard not only enhances usability but also offers powerful tools for data analysis and real-time monitoring. We believe these updates will significantly improve your interaction with our platform, making it easier to manage and analyze your captcha solving activities.
Explore the new CapSolver dashboard today and take your captcha solving experience to the next level. For more details, visit CapSolver.


